

The Premier League is arguably the most popular soccer league in the world. For that reason, the attention and debate surrounding it is non-stop. Each season, the main point of contention is which team comes out on top after 38 games. In the opening weeks, the Premier League title is anybody’s game, from favourites such as Manchester City and Liverpool to 2015’s underdog story in Leicester City. As the season progresses, clear title contenders and relegation candidates emerge.
In our last article, Learning the soccer transfer market through text analytics, we explored a facet of how we can use text data to provide insights in soccer. This time around, we pivot our research to expand how text data may play a role in an evolving analytics scene. To do so, we will look at what sort of end-of-season standing predictions arise when combining early season results with text data obtained from match summaries.
The proposed method to approach this problem is a combination of two models. The first is a simple time series model using early table standings to forecast final point tallies at Matchweek 38. The second model utilizes the collected text data, outlined below, as input to a regression model that makes the same prediction for point tallies after Matchweek 38. These two results are aggregated to obtain how many points a team finishes with at season's end. From this, we can predict end-of-season standings to see who will win the Premier League title, secure Champions League spots, and who will fall to relegation.
Data Collection
Before diving into the methodology and analysis of the results, we will briefly touch upon the data we are using.
To get the league standings at each Matchweek, we collected data from the Premier League website's live table. This data was collected for the 2019-2020 season to validate and assess the model, and the current 2020-2021 season, for testing. The latest date used for the testing data was Matchweek 27, meaning the task at hand is to predict the remaining thirty percent of the season.
A challenging barrier to overcome with text analytic projects is the lack of easily accessible data, something we dealt with in the last project. This time around, we searched for a vast source of text data to ensure each piece of text had similar properties and intention, which brings us to NBC Sports Edge, formerly known as RotoWorld. This website provides post-game summaries of each Premier League fixture, contributing important information, such as the associated team and notable players from the game. Keep in mind that the notable player is not necessarily the team's top performer. Here is a match summary from Tottenham Hotspur vs. Manchester City on February 13th, 2021:
Key player: Harry Kane
Summary: “Spurs only managed to put three shots on target against Manchester City. Even more impressive is the fact that Harry Kane didn't manage a single touch inside the Manchester City penalty area…”
To collect this data, we primarily used two Python libraries; Selenium, to access the content; and BeautifulSoup, to parse the HTML elements to isolate the desired information. This accumulates 5,000 text summaries across two seasons, where each summary has approximately 300 words.
Data pre-processing
For the regression task at hand, that is, predicting a final point tally from a bunch of text data, we wanted a generalizable model so that given text data on any team, it could make a plausible prediction. Each text summary contains some degree of personalized content regarding the team in question or a particular player, such as this text.
Wolverhampton vs. Chelsea (September 14th, 2019)
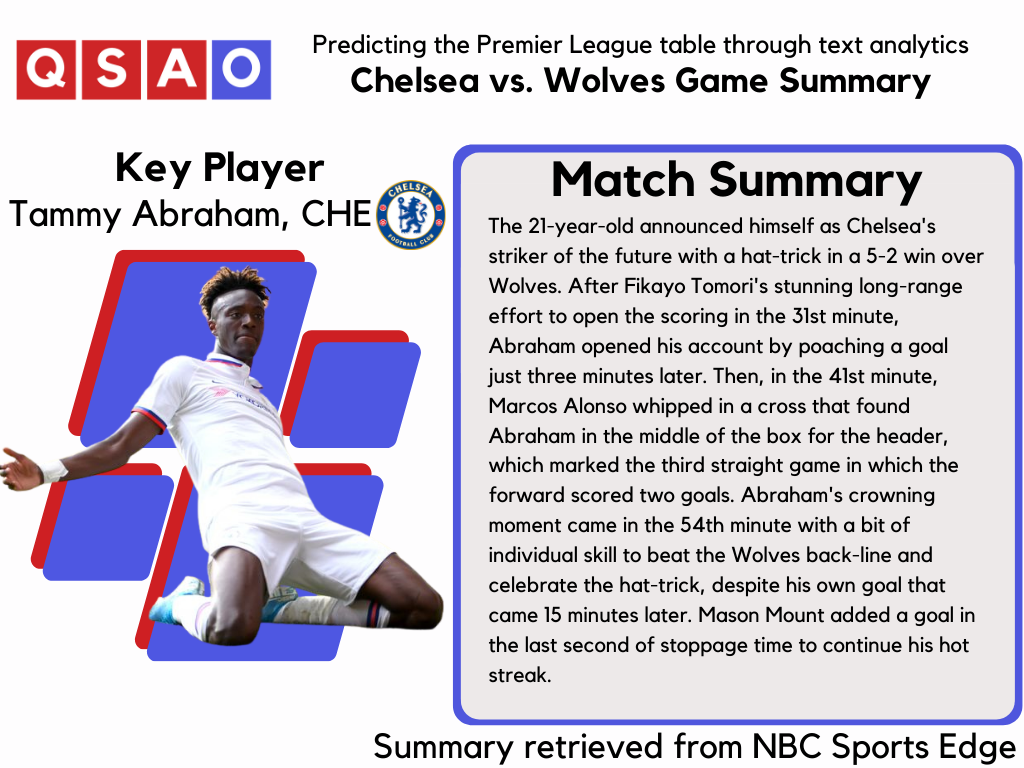
This summary is particular to Chelsea, with multiple references to Tammy Abraham, the 21-year-old mentioned above, Marcos Alonso, and Fikayo Tomori. If we constructed a model specifically for Chelsea, including the names of star players would likely be a strong indicator of a team's win or good performance.
But, as we aim for a model that can take text data from any team and ignore the personalized language, this doesn’t help encourage generalizability. From the above text summary, relevant information that would characterize a well-performing team versus one tending to lose games would be:
Hat-trick
<NUM>-<NUM> win over ____
Open the scoring
Individual skill
Added a goal
These points start to give us an idea of the kind of information that differentiates a team finishing with 60-plus points from a team that will finish with 40 or less amid a relegation battle.
Following the line of thought above provides a way to process the data, encouraging a more generalizable model. The points below outline the steps taken when cleaning the data.
Removing names: these can be players, managers, or organizations. As mentioned, this is to remove the personalized aspect from the text summaries
Removing numbers and punctuation. This is done in the hopes the model picks up on the text data's qualitative differences
Lemmatizing the words to reduce vocabulary size. E.g. Shooting, Shoot or Won, Win
Removing stop words such as: the, and, but, so,… These are words that frequently appear and provide no contextual information
Lastly, lowercasing all the text to further reduce possible variations of the same word
So, the previous text summary example after pre-processing becomes:
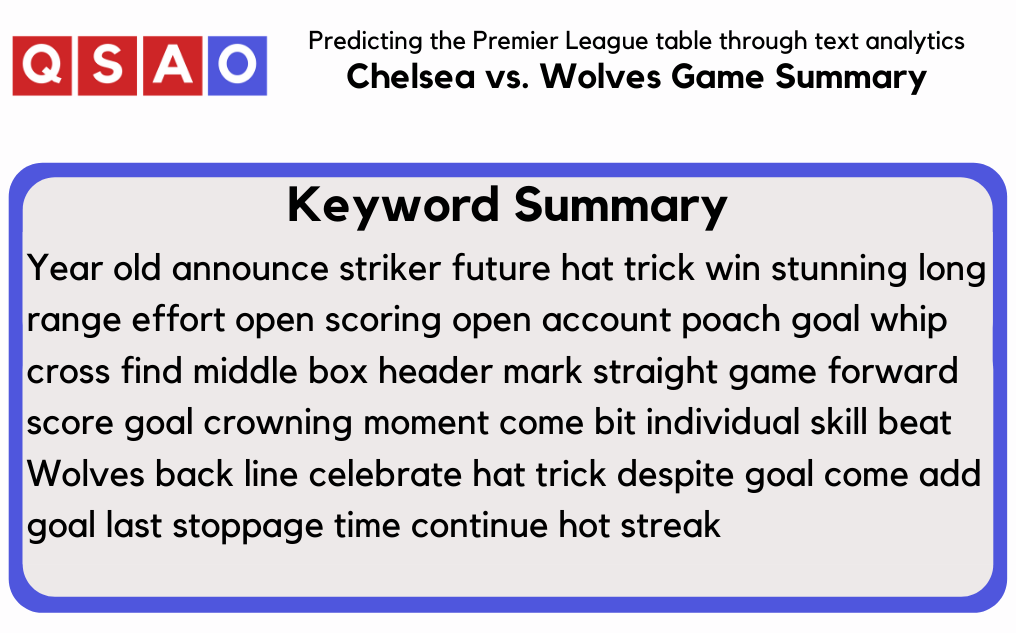
Although pre-processing does not perform perfectly for every text summary, it makes a sufficient step towards making the data more suitable for extracting useful information. To see whether that is truly the case, we will look at how various models perform and where such shortcomings may be.
Model Formulation
First Iteration
To have confidence in the predictions for this season, we needed to find a way to validate our model. Given that it would not be possible to split data from this season into a typical train and test set, we instead collected data for the 2019-2020 season and used that as a means to validate the model. We can do this because we know the final standings of the previous season.
To evaluate different approaches and algorithms using the validation data, we partitioned the teams into four random groups of five. Then, for each group, a model was trained on the other fifteen teams, finally testing on the remaining five teams to assess how the approach performed.
As data for the 2020-2021 season only contains text data up until Matchweek 27, we replicated this scenario while validating models to reduce discrepancies between how we make predictions for the current season and how they are during model validation.
As regression methods require numerical data to learn and make predictions, I had to transform the text data to some numeric representation. Initially, the plan was to use Latent Dirichlet Allocation (Python implementation), which uses keywords to form the likely topic of the data. These topics are represented numerically by a vector of probabilities meaning all the values are within zero and one. As the topics will be very similar given all the text corresponds to match summaries, this will make discovering differences in the data difficult, and, in turn, predictions will be similar.
As regression methods require numerical data to learn and make predictions, I had to transform the text data to some numeric representation. Initially, the plan was to use Latent Dirichlet Allocation (Python implementation), which uses keywords to form the likely topic of the data. These topics are represented numerically by a vector of probabilities meaning all the values are within zero and one. As the topics will be very similar given all the text corresponds to match summaries, this will make discovering differences in the data difficult, and, in turn, predictions will be similar.
Instead, we opted to use the term frequency-inverse document frequency vectorizer (Tfidf vectorizer) from the Sklearn package in Python. This vectorizer utilizes a word's frequency to define its informativeness, so a word that appears less often is considered to hold more weight.
With the numeric representation, we can now pass it on to models such as K-Nearest Neighbours, Support Vector Machines and Gaussian Processes, all available from Sklearn. The table below highlights the cross-validated error (Root mean square error, RMSE) for each model type and any associated notes.

Here, the cross-validated error is easily interpretable since the error metric is RMSE. Each unit signifies a misassigned or unassigned point in any of the four validation folds. More clearly, if for Chelsea, the model had predicted they would finish with 60 points when in reality, for the 2019-2020 season, they had 66, then the RMSE would be six.
At first glance, across predictions for 20 teams, this seems like a good error score, but in looking further into the results, it is clear there’s room for improvement. Due to how the Premier League table shakes out, there tend to be two small sets of outliers; the title contenders and the relegation bound. Additionally, since the middle of the table is typically so close in scoring, the model naturally learns to predict point tallies in this range. Thus their cross-validation error will be small, counteracting the larger error obtained from outliers such as the title-winning Liverpool (99 points), runner ups Manchester City(81 points), and relegation bounds Bournemouth (21), Watford (34), and Norwich City (34). These teams have errors of 40.8, 27.2, 21.7, 34.7 and 21.6, respectively – all higher than the cross-validation error.
Second Iteration
To accommodate for the grouping caused by mid-table teams, we devised a second model. This second model aimed to capture season form trends. We accomplished this by fitting a time series to the weekly point tally of each team. With this data, we forecasted a team’s point tally for the remaining Matchweeks. Since we are focused solely on the point tally at Matchweek 38, we only pull that value to aggregate with the regressor’s prediction. The resulting value is the final predicted point tally from the model.
Further, we incorporated a second component into the model, using season form as a factor by individually fitting a time series model for each team on their point tally throughout Matchweek 1-27. That time series then forecasts until the end of the season, predicting their points at the end of the season. We aggregate this forecast alongside the regressor prediction to obtain a final point tally.
Below is an updated table displaying the model’s results.

The Gaussian Process model sees the smallest improvement but remains the best performing model, which we will move forward with for our predictions.
Predicting the 2020-21 season
Premier League table projections — The Citizens remain dominant

At first glance, the predicted values appear reasonable, but when we start to connect the point tallies to the associated teams, the model's flaws begin to appear.
The most shocking prediction here is Fulham finishing in 11th place. Looking at their current standing as of March 22nd, 2020, Fulham sits 18th with 26 points. For the Lilywhites to reach 50 points this season, they would be required to win their final eight games, in matchups that include Arsenal, Chelsea and Manchester United. Although possible, a valiant effort from Tom Cairney and co. is necessary.
We can likely chalk up this prediction to a strong run of form in Matchweeks 22-27, identified by the time series model, as seen in our rolling table standings below (you can see the sharp upward trajectory from the relegation zone to mid-table at around Matchweek 23).
Another intriguing prediction is Liverpool FC, who have seen a fall from grace after an extraordinary title-winning season last year. Looking set to repeat as champions midway through the competition, they then went winless in four-straight games. Liverpool’s abhorrent form likely characterized a declining trend which the time series model picked up on, resulting in a lower point tally. It will be interesting to see how they finish the season and whether they can bounce back into form for the remaining stretch of games.
With the consistent dominance of Manchester City and the periods of struggle for other title-challenging teams, it is no doubt that the model chose them as a clear-cut winner for the Premier League title. Looking at the league standings, it seems as though nothing short of a miracle will take the title away from Manchester City this season. So, instead, we’ll dive into a few other interesting observations.

The relegation battle – Brighton, Newcastle, and West Brom miss the cut
The model predicts that the battle to avoid relegation will be close this year, with Brighton & Hove Albion, Newcastle United, and West Bromwich Albion chosen as the teams to go down this year. Currently, Fulham, West Bromwich Albion, and Sheffield United are all in relegation positions, with eight or nine games to go. The Blades and the Baggies have dug themselves the largest holes, with only 14 and 18 points, respectively. Throughout Sheffield United’s final nine games, we will see if they can string together a run of wins to fulfill the model’s expected heroic escape.
European hopefuls – Gunners look to close out strong
As mentioned, Manchester City looks guaranteed to secure the title this year with a fourteen-point lead on runners-up Manchester United and only three losses out of their 30 matches. So, without a doubt, we expect to see City playing football among Europe’s elite next season. But who’ll be joining them?
Well, according to the model, both Leicester City and Manchester United will continue their strong seasons to secure Champions League spots next year. In what many would consider a surprise, Everton projects to take the final spot, barely beating out rivals Chelsea. Everton making the Champions League would be unexpected, but many forget their incredible start to the season led by Richarlison, James Rodríguez and Dominic Calvert-Lewin. If any combination of these three can re-obtain their early season form, do not be surprised if Everton makes a strong push for fourth.
Moving on, Arsenal and Chelsea look to share the honour of competing in the Europa League next season. With both sides currently battling in their respective European competitions, these placements may be passed along contingent on either club winning. Regardless, Chelsea is a likely bet for Europe next season, given their current league position, but Arsenal, sitting in ninth, has some work to do.
Despite a poor start to the season, the Gunners have kept faith in manager Mikel Arteta. His persistence to start youngsters such as Emile Smith-Rowe, Bukayo Saka, and recent signing Martin Ødegaard has sparked life into the team, who are now moving on to the quarterfinals of the Europa League and continue to steadily climb the league table.
Given the cumulation of recent form for these teams and the hype around their associated star players, the predictions for teams set to clinch a European spot are sensible, even-if bold.
Lastly, we will highlight some key methodology points identified from the work. First, web-scraping unlocks new avenues and unique data sources, typically not readily available. Second, combining multiple models can lead to unique insights and results. In our case, this was a combination of a text-data regressor and a time series model. Finally, models in the soccer domain still require a helping hand to navigate particular rules. The time series can assign a team more than three points in a Matchweek.
In closing, the model put forth a mixed bag of predictions. While some were straightforward, such as Manchester City, others were much less expected, such as Sheffield United escaping relegation. So, as only nine Matchweeks remain, we will closely monitor the table and are excited to follow the pivotal fixtures that could make or break the model’s outlook.
Statistics retrieved from NBC Sports Edge and The Premier League
Cover graphic credited to Carl Recine — Reuters