

Two thoughts popped into my mind, one after the other.
First, I wondered whether an NHL player’s performance fluctuated depending on how long they had been on the ice. Does short-term fatigue play a significant role over a single shift?
Second, I wondered how to quantify (and hopefully answer) this question.
The Data
Enter the wonderfully detailed shot dataset recently published by moneypuck.com. In it, we have over 100 features that describe the location and context of every shot attempt since the 2010-11 NHL season. You can find the dataset here: http://moneypuck.com/about.htm#data.
Within this data I found two variables to test my idea. First, the average number of seconds that the defending team’s defensemen had been on the ice when the attacking team’s shot was taken. The average across all 471,898 shots was 34.2 seconds, if you’re curious. With this metric I had a way to quantify the lifespan of a shift, but what variable could be used as a proxy for performance?
Fortunately, the dataset also says whether each shot was a rebound shot. To assess defensive performance, I decided to use the rate at which shots against were rebounds. Recovering loose pucks in your own end is a fundamental part of the job description for NHL defensemen, especially in response to your goalie making a save. Should the defending team fail to recover the puck, the attacking team could generate a rebound shot, which would often result in a goal against. We can see evidence of this in the 5v5 data:

Rebound shooting % is 3.6x larger than non-rebound shooting %
The takeaway here is that 24.1% of rebound shots go into the net, compared to just 6.7% of non-rebound shots. Rebounds are much closer to the net on average, which can explain much of this difference.
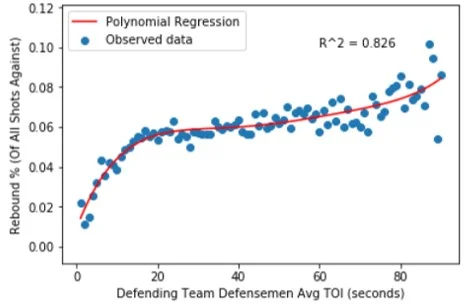
I believe that a player’s ability to recover loose pucks is a function of their ability to anticipate where the puck is going to be and their quickness to get to there first. While anticipation is a mental talent, quickness is physical, meaning that a defender’s quickness could deteriorate over the course of their shift as short-term fatigue sets in. Could their ability to prevent rebound shots be consequently affected? Let’s plot that relationship:

There’s a lot going on here, so let’s break it down.
The horizontal axis shows the average shift length of the defending defense pairing at the time of the shot against. I cut the range off at 90 seconds because data became scarce after that; pairings normally don’t get stuck on the ice for more than a minute and a half at 5v5. The vertical axis shows what percentage of all shots against were rebounds.
Each blue dot represents the rebound rate for all shots that share a shift length, meaning that there are 90 data points, or one for each second. The number of total shots ranges from 382 (90 seconds) to 8,124 (27 seconds). Here’s the full distribution:

We can see that sample size is an inherent limitation for long shifts. The number of shots against drops under 1,000 for all shift lengths above 74 seconds, which means that the conclusions drawn from this portion of the data need to be taken with a grain of salt. This sample size issue also explains the plot’s seemingly erratic behaviour towards the upper end of the shift length range, as percentage rates of relatively rare events (rebounds) tend to fluctuate heavily in smaller sample sizes.
The Model
Next, I wanted to create a model to represent the trend of the observed data. The earlier scatter plot tells us that the relationship between shift length and rebound rate is probably non-linear, so I decided to use a polynomial function to model the data. But what should be this function’s degree? I capped the range of possibilities at degree = 5 to avoid over-fitting the data, and then set out to systematically identify the best model.
It’s common practice to split data into a training set and a testing set. I subjectively chose a split of 70-30% for training and testing, respectively. This means that the model was trained using 70% of all data points, and then its ability to predict previously unseen data was measured using the remaining 30%. Model accuracy can be measured by any number of metrics, but I decided to use the root mean squared error (RMSE) between the true data points and the model’s predictions. RMSE, which penalizes large model errors, is among the most popular and commonly-used error functions. I conducted the 70-30 splitting process 10,000 times, each time training and testing five different models (one each of degree 1, 2, 3, 4, and 5). Of the five model types, the 5th degree function produced the lowest root mean squared error (and therefore the highest accuracy) more often than the degree 1, 2, 3 or 4 functions. This tells us that the data is best modelled by a 5th degree polynomial. Fitting a normalized 5th degree function produced the following equation:

x = shift length in seconds
This equation is less interesting than the curve that it represents, so let’s look at that:
What Does It Mean?
The regression appears to generally do a good job of fitting the data. Our r-squared value of 0.826 tells us that ~83% of the variance in ‘Rebound %’ is explained by defensemen shift length, which is encouraging. Let’s talk more about the function’s shape.

Rebound rate first differences decrease at first as the rate stabilizes, and then increase further
As defense pairings spend more time on the ice, they tend to surrender more rebound shots, meaning that they recover fewer defensive zone loose pucks. Pairings who are early in their shift (< 20 seconds) surrendered relatively few rebound shots, but there's likely a separate explanation for this. It's common for defensemen to change when the puck is in other team’s end, meaning that their replacements often get to start shifts with the puck over 100 feet away from the net they're defending. For a rebound shot to be surrendered, the opposing team would need to recover possession, transition to offense, enter the zone and generate a shot. These events take time, which likely explains why rebound rates are so low in the first 15-20 seconds of a shift.
We can see that rebound rates begin to stabilize after this threshold. The rate is most flat at the 34 second mark (5.9%), after which the marginal rate increase begins to grow for each additional second of ice time. This pattern of increasing steepness can be seen in the ‘Rebound Rate Increase’ column of the above chart and likely reflects the compounding effects of short-term fatigue felt by defensemen late in their shifts, especially when these shifts are longer than average. The sample size concerns for long shifts should again be noted, as should the accompanying skepticism that our long-shift data accurately represent their underlying phenomenon.
The main strategic implications of these findings relate to optimal shift length. The results confirm the age-old coaching mantra of ‘keep the shifts short’, showing a positive correlation between shift length and rebound rates. Defensemen shift lengths should be kept to 34 seconds or less, ideally, since the data suggests that performance declines at an increasingly steep rate beyond this point. Further investigation is needed, however, before one can conclusively state that this is the optimal shift length.
Considering that allowing 4 rebound shots generally translates to a goal against, it’s strategically imperative to reduce rebound shot rates by recovering loose pucks in the defensive zone. Better-rested defensemen are better able to recover these pucks, as suggested by the strong, positive correlation between defensemen shift length and rebound rates. While further study is needed to establish causation, proactively managing defensive shift lengths appears to be a viable strategy to reduce rebound shot rates.
Any hockey fan could tell you that shifts should be kept short, but with the depth of available data we're increasingly able to figure out exactly how short they should be.
Cover photo credited to Sergei Belski — USA Today Sports