
As the 2021 MLB season propels full speed out of its third month, we are here with an important look at the numbers behind one of the record-breaking events happening across the league. Yes, it’s about pitching; no, it’s not about “sticky stuff”... It’s about the fact that MLB pitchers have had seven incredible outings in which the Seattle Mariners, Cleveland Indians, Texas Rangers, and LA Dodgers have amassed a total of 0 hits (yes, that’s twice for some teams).
Read MoreBaseball
Does the MLB Home Run Derby affect second half performance? /
As the halfway mark of the MLB season rolls around, baseball and sports fans alike look forward each year to the ever-entertaining evening that is the Home Run Derby. The goal is simple; hit the most home runs. Despite the widespread celebration of the event, some critics bring up the so-called “Curse of the Home Run Derby” every year. In this article, we will determine if there is any truth to this myth or if we can simply enjoy watching our favourite players participate without worry.
Read MoreDid the Rays misuse “Cybermetrics” when removing Blake Snell? /
By now you have probably heard that the Los Angeles Dodgers are the 2020 World Series Champions. In past World Series-clinching games, the defining moment is usually the result of a game-changing home run, a timely strikeout or clutch individual performance. Unfortunately, this year’s was all about the clutch performance that could have been. In this article, QSAO Analyst Nic Osanic breaks down the Rays’ decision to pull Blake Snell from Game Six of the World Series.
Read MoreThrowing by the Numbers: Data-based pitching success stories /
As we’ve seen, there are many kinds of adjustments that pitchers can make to improve their performance. Some pitchers may change their arm slot, find new grips, or alter other elements of their delivery. In the end, there is a good chance that every pitcher can find subtle ways to improve no matter how good they already are. In the final instalment of The Art of Pitching, QSAO Analyst Nic Osanic investigates examples of pitchers decreasing the usage of their sinker and 2-Seamer in-favour of other pitches.
Read MoreThrowing by the Numbers: Other determinants of high 4-seam fastball success /
Previously, we discussed how pitch selection, location, and velocity can all impact the swing and miss ability of different pitches. We saw how velocity clearly makes a difference when it comes to the success of 4-Seam fastballs as long as the pitch is thrown high over the plate. However, guys like Aroldis Chapman, Noah Syndergaard, and Ken “100 Miles” Giles all throw triple-digit high heat but don’t appear on any of the high fastball success leaderboards in the previous articles. Why is that? Well, this likely means that there is more to fastball success than just location and velocity. So what other significant factors could we be missing?
Read MoreThrowing by the Numbers: A closer look at the impact of fastball velocity /
In QSAO Analyst Nic Osanic’s previous article, we discussed the importance of fastball location and how pitching in the high and low portions of the strike zone can yield dramatically different results. One of the strongest examples of this was shown through Gerrit Cole. There were other technicalities at play, but essentially, Cole’s new data-driven approach allowed him to make better use of his elite pitches by throwing them more, and in areas where they were more effective, turning him into arguably the best pitcher in baseball. Now, QSAO Analyst Nic Osanic analyzes the effect of proper pitch selection and location in the modern-day MLB.
Read MoreThrowing by the Numbers: An analytical take on the art of pitching /
Pitching philosophy in baseball has long been a game of conventional wisdom. This philosophy always seemed to make sense as the lower the pitch, the easier it is to swing over the top and hit it on the ground. As more data has become available in recent years, batters have started to adjust. As the MLB’s data-driven pitcher/batter pendulum constantly swings in response to such change, one must wonder how traditional attitudes towards fastball locations affect the modern-day MLB pitcher. In QSAO’s latest series of articles, analysts Nic Osanic takes a deeper look into the art of pitching.
Read MoreRoad to the Show: Identifying factors that lead to success in the MLB /
As we look into the present state of our favourite team - the Toronto Blue Jays, we hope to use a form of this popular sabermetric analysis to find a silver lining amid both the team’s poor performance over the past seasons and the delayal of the whole MLB 2020 season due to the recent COVID-19 pandemic. Currently, the Blue Jays’ roster and farm system are stacked with rookies who show great potential - at least that’s what we, as fans, choose to believe. To confirm our hopes for the team’s future, we have chosen to determine which MLB Rookie stat serves as the greatest indicator for career success in the league. We will use Python and its BeautifulSoup, numpy, and pandas libraries to create models based on Machine Learning methods which will reveal important correlations, validate our results, and ultimately, be capable of predicting the future of the Toronto Blue Jays.
Read MoreHow Liverpool’s run of form has affected the Premier League standings: A case study in Expected Goals /
Liverpool’s Premier League unbeaten streak of over a year has been incredible. Currently sitting atop the table with 73 of a possible 75 points, Liverpool is on pace to set a record-breaking total of 110 points, 10 more than City’s record of 100 from 2 years ago… What is the probability that Liverpool actually deserves to be where they are in the table?
Read MoreQSAO's Analytics Mythbusters: Breaking down positional nuances (Part Two) /
As we progress through the seasons of various professional sports, we start to notice trends worth looking into. As I have ben to expand my analytical prowess, I have learned to develop my own questions, and look to answer them through the published work of others – something that QSAO does for the sports community (Look out for all-new content next semester! – shameless plug). But I digress, in Part Two of the latest edition of QSAO’s Analytics Mythbusters, we look into load management in the NBA and how the Houston Astro’s sign-stealing scandal affected team performance.
Read MoreMajor League Baseball capacity rates: Analyzing fan attendance using panel data /
By Cody Smith and Patrick Mills
A note from the article’s editor (Anthony Turgelis): This article will read somewhat differently from the rest of our content, as this was a detailed final project for a 4th year Applied Econometrics course at Queen’s. I hope you enjoy the format, as it is more typical for analytics research projects.
Introduction
Major League Baseball has been recognized as a staple of American culture since its inception in 1869. Over generations, the League has transformed from humble beginnings into an organization with 30 franchises over North America each playing 182 games per season. This period has seen franchises experience different levels of success when attempting to attract fans to games, and this variation has drawn the attention of many Economists looking for an answer as to why. Ahn and Lee (2014) found that from 1904-1957, fans were captivated by teams with the most winning record. This period was followed by a change in preference which Ahn and Lee identified as a desire for competitive games (1958-2012). Now, in the modern era, sports fans have a variety of professional sports to watch, as well as the ability to follow and support teams from a distance thanks to increased media coverage and reduced costs of transportation. Similar to how companies in retail rely on branding to differentiate themselves and attract customers, it is likely that branding will become increasingly important for MLB franchises as they compete with a growing number of substitute franchises across sports to attract people to fill seats at games. This paper will examine the effect of Brand Equity Value (BEV) on capacity rates across MLB franchises. Our computation of BEV will be explained in our description of data. If the relation between BEV and capacity rates is found to be statistically significant, it could have major implications as it would provide compelling evidence of a new shift in fan preferences. Franchises would have to choose how to market themselves to stimulate interest among local and distant baseball fan bases alike. Evidence for a shift in fan preferences would also provide considerations for the MLB when creating policy to promote and protect the league’s growth and popularity.
The remainder of this paper will be structured as follows: The second section will provide a commentary on existing literature discussing factors of MLB attendance. The third section will describe from where the data used in this paper as well as provide further explanation of BEV. The fourth section will explain the empirical model used in our regression analysis, as well as why it was chosen. The fifth section will present our regression tables as well as a commentary on the results. Finally, the sixth section will conclude with a summary of this papers findings as well as the importance and implications of these results.
Literature Review
Economists have published a collection of articles speculating over the key determinants of attendance for Major League Baseball franchises. Nesbit and King (2012) released a report finding that fans who play fantasy baseball are more likely to attend games, while Mittelhammer, Fort, et al., (2007), found increasing proximity between teams had an adverse effect on attendance in accordance with Hotelling’s model that consumers buy goods from the closest supplier. Ahn and Lee (2014) concluded that in earlier years of baseball (1904-1957) fans had been drawn to teams with winning records – the better the record, the higher the turnout – before a new era of baseball (1958-2012), saw fans who were drawn to games based on uncertainty of outcome, size and quality of the stadium as well as the playing styles of the teams. Throughout the literature however, one overarching determinant became reoccurring: the maintenance of a competitive balance in the league. Berri and Schmidt (2001) investigated this matter and concluded that as the league became more competitive, attendance could be expected to increase. Lemke, Leonard, et al. (2010), who attempted to establish a relation between promotions and giveaways in small and large markets on attendance, found competitive balance to be a significant factor of attendance. Ahn and Lee (2014), reached the same conclusion as well. Economists approaching the subject seem to agree that competitive balance is essential to the interest of fans as well as the financial health of the league. Lee (2016), showed that fans consider characteristics of home and away teams when making attendance decisions. In the same report, Lee also hypothesized that modern era baseball fans had less incentives to cheer for the home team, citing development of media and greater access to information, mobility in residence and reduced transportation costs as factors that would allow fans to pick and choose a team they wanted to support, rather than teams in close proximity. While this is still consistent with competitive balance, if true, previous methods of incentivizing local fans to attend games would prove to be less efficient.
Description of Data
The primary data that was utilized in our regression model was obtained from ESPN, Sports Reference, Statistics Canada, Statista and the United States Census Bureau. Supplementary information used from Boston Globe Media Partners examined MLB ticket prices, and this paper took data presented by Forbes Media to establish franchise valuations. Data from ESPN and Sports Reference provided information on stadium capacity rates, strength of schedule, win rate over .500, estimated payroll, homeruns per game, and pace of games. The United States Census Bureau and Statistics Canada data pools were used to establish the demographic parameters of population and median household income. Data from Statista was referenced to establish ticket prices. We also took into consideration the addition of professional sports teams to cities with MLB franchises by including a dummy variable. If these arriving franchises were a part of a big four league (NHL, NFL, NBA, MLB), the existing MLB franchise was given a value of 1, while MLB teams in cities that did not gain a professional team were given a value of 0. Those that lost a franchise were given a value of -1. We also assigned a dummy variable to account for MLB franchises that moved into a new stadium over the period of examination. Teams that moved were assigned a value of 1 while teams that did not were assigned a value of 0. It is important to note that this is a potential source of error in our paper as teams who moved from a larger stadium to a smaller stadium will have experienced an increase in stadium capacity rate without a real increase in game attendance. Data from these sources was used to collect relevant information from all 30 MLB teams in the years 2008 and 2018, with a total of 60 observations.
Our primary measure deals with the evaluation of brand equity and is represented by the variable BEV. To accurately quantitate this qualitative statistic, we standardized four separate variables and used the average of the values to compute each franchises BEV statistic. As we only took data from separate two years, it was only possible to determine the effect of BEV in 2018. These four variables used for our BEV statistic are as follows:
1. Market share – Presence in the market (2018 season)
a. % of market share per team
b. Individual team valuation/Sum of MLB team total valuation
2. Transaction value – Price offered for service (2018 season)
a. Average ticket prices/team
3. Success generation – Team performance change (2008-2018)
a. (Win % 2018 season/Win % 2008 season)-1
4. Growth rate – Team valuation change (2008-2018)
a. (Team valuation 2018 season/Team valuation 2008 season)-1
Table 1. Definition of Variables

Figure 2. Summary Statistics

Empirical Model
To estimate the determinants of capacity rate, we have chosen to use a panel data regression. To decide between a fixed effects and random effects model, a Hausman test was conducted. After our results yielded Prob>Chi2= > 0.05, we chose to use a random effects GLS regression. This method will allow us to compare common factors of short-run demand to determine capacity rates in our given seasons, 2008 and 2018.
Equation (1) presents our basic empirical model of MLB game attendance:

Table 1 included in our description of data provides an explanation for each variable included in our empirical model. Using a random effects model is this instance is useful as the variation across franchises in our model is assumed to be random and uncorrelated with the predictor or independent variables included. Random effects assume that the error term is not correlated with the predictors, and under this assumption a random effects model will produce unbiased estimates of the the coefficients, use all the data available, and produce the smallest standard of error. After running our random effects GLS regression, we ran a simple OLS regression to determine how much of the variation in capacity rates could be explained by our Brand Equity Value variable, BEV, which will serve as our primary parameter of interest.
Results and Discussion
After running our random effects GLS regression, we found three variables to be statistically significant. They were: estimated payroll for the season, home runs per game and franchise value. Our R-squared was 0.6407, and shows a strong correlation between the effect of the variables on the capacity percentage for MLB teams.

After running this regression, we tested our BEV statistic against the 2018 results to determine how much of the effect could be could attributed Brand equity value.

We found BEV to be statistically significant, with an R-squared value of 0.5196, meaning that 52% of the change in capacity percentage across MLB franchises can be accounted for by our constructed BEV variable. To the best of our knowledge, this paper is the first Economic evaluation of the effects of Brand Equity on capacity percentage, which is a direct measure of fan demand for a franchise. Our findings from our random effects GLS regression were consistent with existing literature, as estimated payroll, homeruns per game and franchise value have consistently been significant indications of attendance.
Conclusion
The purpose of this paper was to establish an understanding of the impact of different variables on the capacity rate of MLB franchises. We took a collection of data from the 2008 and 2018 MLB season, as well as corresponding data of demographics and ran a random effects GLS regression, followed by a linear regression to determine how much of the change in capacity rates could be explained by our variable of interest, BEV. We found three variables in our random effects model to be statistically significant: estimated payroll, homeruns per game, and franchise value. Our findings in this regression are consistent with the literature. The results of our linear regression proved our hypothesis that Brand Equity Value plays a statistically significant role in determining capacity rates for franchises across the MLB. These findings are important as they indicate that fan preferences may be changing again, which is an observation that has been made in the literature over different periods. A change in fan preferences will have implications relating to economic and policy decisions as franchises attempt to stimulate fan interest by providing different amenities and incentives to differentiate themselves from the competition. The success of these efforts has implications for the municipalities and regions that generate tax revenue from the operations of these franchises, and could impact future decisions regarding expansion and relocation of MLB franchises.
What makes a Top 10 pitcher? /
In baseball statistics, an earned run average (ERA) is the mean of earned runs given up by a pitcher per nine innings pitched. I decided to take a deeper look to see what goes into the ERA of a pitcher. In this study, I divided all the qualified pitchers from the last five years into two groups; top 10 ERA and non-top 10, as a means to determine what makes a top 10 ERA pitcher.
Using four indicators; strikeout percentage, walk percentage, left on base percentage, and BABIP (batting average on balls in play) we can figure out the probability that a pitcher will finish in the top 10 in ERA. I ranked all the pitchers in the last five seasons by these categories, and put them into a big matrix of numbers based on their rankings. To indicate if they finished in the top 10 ERA category, I put a 1 for top 10, and a 0 for finished outside the top 10. I used each pitcher’s yearly rank instead of their actual numbers because each year’s top 10 is different. Therefore, it is important to compare numbers on a year- to-year basis.
Some of the chart looks like this:

To find a prediction, I used a program in R called XGBoost. XGBoost takes the information based on the previous data and tests to see if there is a pattern between where the pitcher finished in rank, and if he finished in the top 10 of ERA in the season. After running the numbers with different parameters on XGBoost we can determine two things. The program tells us which of the four stats is most indicative of a high ERA rank, and which pitchers were outliers (the model predicts the outcome).
First, let’s look at which stat is the most predictive in determining the rank. Surprisingly, LOB rank has the most impact on a pitchers ERA rank. Note that these aren’t percentages, rather they are used to show the relative importance in each stat in predicting ERA.

This chart shows that where the pitcher finishes in LOB percentage is the best predictor. Interestingly enough, the pitcher that had the highest LOB percent (he left the highest percentage of runners on base) each of the last five years finished in the top 10 in ERA. Also, out of the pitchers that finished in the top five LOB percentage, 20 out of the 27 (there was one three-way tie) finished in the top 10. The chart also shows that LOB rank and K rank are much more significant than BB rank or BABIP rank.
Next, let’s look at the predictive aspect of the model. I ran the model using a number of different combinations of test and training data, and then had it predict on the pitchers. The model predicted around 85 percent of the pitchers correctly. Now, let’s look at a few pitchers that the model incorrectly predicted and why this data was wrong.

Garrett Richards finished the 2014 season with a 2.61 ERA, which placed him 10th in the MLB. However, the model predicted that Richards would finish outside of the top 10 with those ranks. One explanation for why Richards finished with a good ERA is his HR rate. He had a 0.27 HR/9 rate in 2014, which was the lowest of any qualified pitcher in the last five years. So, while he allowed a lot of baserunners, not a lot came in because of the fact that he could keep the ball in the yard. Richards has been injured the last few years, but his success has been almost completely related to his home run rate.

Stroman in 2017 had an ERA of 3.09, which placed him 9th. What Stroman lacks in strikeouts, he made up for in his ground ball to fly ball rate, as well as his groundball percentage. This allowed Stroman to get easy outs without needing to strike everyone out. Since he got so many groundballs, most of the hits he gave up were singles, which limited the amount of earned runs. He also induced the most double plays in 2017, which helped him get out of innings without allowing any earned runs.

One problem with this model is that it treats everyone outside the top 10 as equals. In 2015, Scherzer had a 2.79 which was the 11th best in the MLB. Even though he finished with a great ERA, the reason he didn’t make it into the top 10 was because of the amount of HR he allowed. He gave up 31 HR which was the most in the NL. Even though he finished in the top 10 in these four stats, his home runs prevented him from being in the top 10 in ERA.

One of the more interesting results was that the model projects Fiers in the top 10 even though he had a 3.56 ERA, finishing 24th in 2018. The reason why his LOB rank is so good, while still consistently giving up runs, is because he gave up the second most HR/9 of anyone in the MLB. While the rest of his numbers look good, like Scherzer, home runs prevented Fiers from having an elite ERA.
Stats from FanGraphs, Baseball-Reference, and Baseball Savant
RBIs - Clutch? Or Opportunity? (xRBI) /
RBIs are often criticized because they are largely dependent on how many plate opportunities the hitter gets with runners on base. Most analytics experts have dismissed RBIs as a dated stat, but many baseball insiders still claim that they have some relevance. We aim to address these flaws and create a stat that everyone can agree on.
Read MoreUsing pitch values to preview the Blue Jays' 2018 starting pitchers /
By: Anthony Turgelis (@AnthonyTurgelis) and Jordan Moore
Data Visualizations by: Adam Sigesmund (@Ziggy_14)
All data from Fangraphs, all projection values from ZiPS.
Baseball is back! Tomorrow afternoon, the Toronto Blue Jays will take on the New York Yankees to open their 2018 season. While there are certainly reasons to be optimistic and pessimistic about this Toronto Blue Jays team, their starting rotation remains to be seen as a strength. This article will first introduce Fangraph’s Pitch Value system and how they evaluate pitch effectiveness, and later preview the Blue Jays starting rotation so it can be seen what every pitcher has to offer.
Fangraphs Pitch Value System
The idea behind the Fangraphs Pitch Value System is to assign run values to how a pitcher performed while using this pitch. They are then compared to the average results, to determine whether each pitch value is below or above average, and by how much. These can also be viewed for hitters, who generate similar calculations based on how effective they are against each type of pitch. For this article, we will use the standardized calculations which are calculated on a ‘per 100 pitch basis’, since each pitcher’s pitch frequency widely varies, but to provide this further context we will also include their pitch mix from the current year.
The limitations of Pitch Values are that they are not always predictive, and can vary from year-to-year. Also, there is likely to be some variance depending on which batters the pitcher had to go up against, since the batter’s ability to hit each pitch will affect the results. If a pitcher were to happen to face batter’s who are less-skilled or less-prone to hitting a curveball (for example), a curveball-heavy pitcher may post higher curveball values due to this lucky arrangement, which may not be entirely indicative of their curveball results going forward. To offset this, their career pitch values will also be included, so if there did happen to be a year where a certain pitch performed wildly different (which again, could be from external factors), their career numbers could also be used to predict their value going forward. In addition, Pitch Values are only calculated for: fastballs (wFB/C), curveballs (wCB/C), changeups (wCH/C), cutters (wCT/C), sliders (wSL/C), knuckleballs (wKN/C), and splitters (wSF/C). Sinkers are included in fastball calculation.
The 2017 best and worst values will also be highlighted for reference on how effective each pitch is to the worst and best values that qualified (large enough sample) starting pitchers have produced. Values here were omitted if the pitch was less used in less than 15% of their pitches thrown, which could create small sample size noise and overstate its value. Using this statistic, let’s see where the Blue Jays Starters stack up against the rest of the league.
J.A. Happ - Opening Day Starter


We begin with the Opening Day starter, J.A. Happ. Happ is a curious case as his career numbers probably don’t reflect his true ability at this point in his career - in a good way. After being traded from the Blue Jays to the Seattle Mariners, the Mariners later flipped Happ to the Pirates at the deadline. Here, Happ linked up with pitching coach Ray Searage, who has notoriously shaped-up the careers of many pitchers. Things clicked for Happ who turned a curveball that was arguably his weakest pitch, to one that achieved very good results, possibly because of its reduced usage.
His career pitch value on his curveball sits at -0.97 - below average - but in the last two seasons has achieved a curveball value of 1.53 and 1.41, above average and ranking him 18th among pitchers who pitched 100 innings of more last season. As seen in the graph, Happ had an above average fastball last year and throughout his career, a not-so-great slider and a not-so-great changeup. The thing to remember here is that these values are rate stats, so the fastball grading out positive is the most important part since it’s a pitch he throws ~70% of the time. Happ had an fWAR of 2.9 last season (38th among pitchers with 100+ IP), and is projected to put up an fWAR of 2.7 this upcoming season. The often-underappreciated Happ should continue to be one of the Jays most consistent pitchers.
Aaron Sanchez - Friday's Probable Pitcher
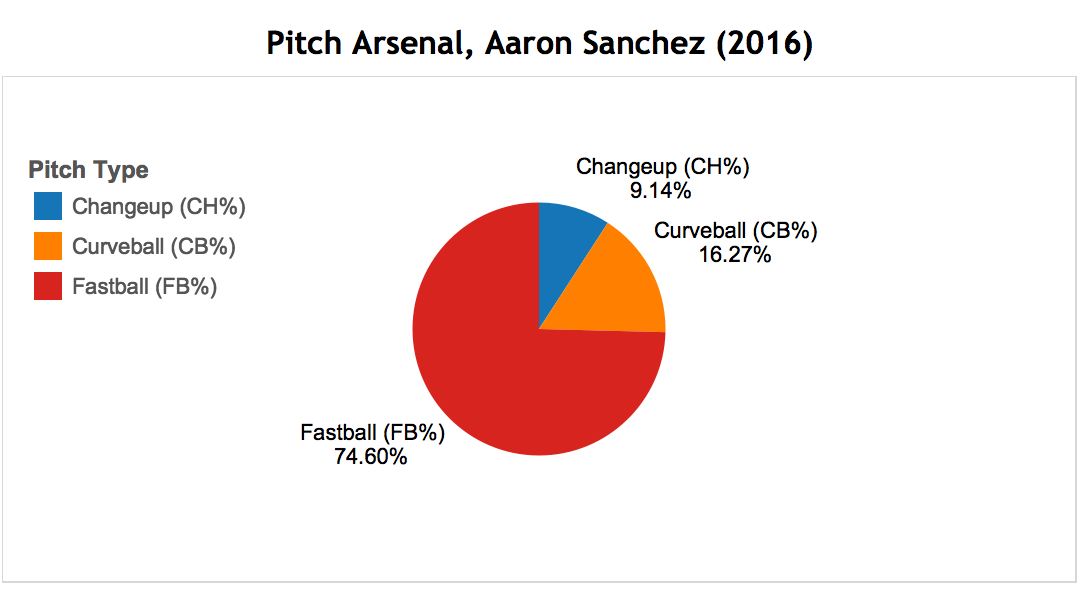

Aaron Sanchez, the 6’4 25 year-old California native is looking to stay healthy and pick up where he left off in the 2016 season. 2017 was a very disappointing season for Sanchez as a blister on his throwing hand kept him sidelined for all but 8 games in the season. In 2016, Sanchez held a 15-2 record with an ERA of 3.00 which was good enough to earn him his first All-Star game nod (replacing injured Craig Kimbrel). Considering Sanchez's small 2017 sample, his 2016 and career numbers will be used for comparison purposes.
In 2016, Sanchez held a fastball value average of 0.94, leading him to throw a fastball 74.60% of the time. What makes Sanchez’s fastball so unique is the ball tends to move like a breaking ball, however it still packs extreme heat causing his fastball to produce great results. Sanchez’s fastball value improved in 2016 compared to his career average of 0.86, so there is lots of optimism the young stud can continue this positive trend if he stays healthy. Sanchez's high value and high usage means that he sits down a lot of batters on his fastball, and it is a top pitch.
In 2016, Sanchez also saw an increase in his curveball value raising to 0.68 compared to his career average of 0.11, so we may see more of a curveball added to his arsenal in 2018 (threw a curveball 16.27% in 2016). Sanchez saw a small increase in his change-up value in 2016 compared to his career average (0.27 to 0.7), so hopefully he can continue to develop his change-up as well. With one all-star game under his belt already, and his fastball, curveball, and change-up all improving in 2016 compared to his career average, Sanchez has a very bright future as he approaches his prime.
If Sanchez can continue to improve in all 3 of his pitches, he has the potential to be a CY Young candidate. In 2016, he produced an fWAR of 3.8, but ZiPS is projecting him at 2.3 fWAR for the coming season. If he can stay healthy, he has a chance to be significantly higher than that, if not the Jays might be in trouble. Injuries seem to be the only thing stopping Sanchez at this point in his career, so he and the Blue Jays will be hoping he stays on the field as much as possible.
Marco Estrada - Saturday's Probable Pitcher


Coming into his fourth season with the Toronto Blue Jays, seasoned veteran Marco Estrada is looking to bounce back from a year where he saw all 4 of his pitches drop below his career averages in value. The 34 year old has been known as a location pitcher throughout his career, putting the baseball in the corners of the strike zone forcing the batter to make difficult decisions on whether to swing or not.
Throughout Estrada’s career, he has evolved into a change-up specialist, however his change-up value fell off a cliff in the 2017 season, dropping below the league average to a weak score of -0.7. This may indicate batters have solved the puzzle of his change-up pitch, or it could indicate age is taking a toll on Estrada’s performance (he will be 35 in July). With a seasoned pitcher like Estrada however, there is always room for optimism as he could rebound in the 2018 season and bring his change-up value closer to his career average where his change-up value sits at 0.63, above the league average. Estrada’s fastball saw an insignificant value drop of 0.05 compared to his career fastball value of 0.28, indicating his arm strength is still healthy while he’s approaching age 35. Estrada saw the biggest drop in his curveball, dropping to a disappointing -1.57 in value, which may explain the low percentage of this pitch choice in 2017 (7.70%). Estrada’s cutter has always been very below average, and he saw this pitch drop in value as well to -1.63 while only throwing a cutter 6.70% of the time. The low percentages of curveball and cutters thrown in the 2017 season indicate he’ll rely heavily on his fastball and change-up again in 2018, so hopefully Estrada can rebound this season and find his change-up groove again.
Even in a down year, Estrada managed an fWAR of 2.6 in 2016, and is projected for 2.1 fWAR this coming season. Estrada was a guy who had outperformed his FIP in each of the three previous seasons before last, and will likely need to find out how to do that again this coming season, and figure out how to surpress contact like he used to.
Marcus Stroman - Sunday's Probable Starter


The would-be Opening Day starter had he not picked up a minor injury in Spring Training, many look to Marcus Stroman as the face of this ball club. Standing at 5' 8", Stroman is proof that Height Doesn't Measure Heart, and that if you can throw a baseball, you do not need to tower over the competition to be a starting pitcher.
Stroman leans heavily on his fastball and his slider, which is a good call considering those are his two best pitches. His slider pitch value is consistently above league average at 1.46 last year and 1.22 throughout his career. He had the 10th highest pitch value out of all qualified starters last year. The movement on this pitch can sometimes be just insane, which is seen in the video below:
Nasty, even though it missed the zone. His fastball grades out as above average as well, which is very valuable given the high usage. His tertiary pitches don't grade out as well, with his cutter and curveball getting near-average pitch values throughout his career. His 2017 cutter value was left in the graph to illustrate how a small sample size can affect this stat. His usage was only 2.4% last year, and a few unlucky results could really sway the pitch value stat. This shouldn't be a reason for concern.
Stroman had an fWAR of 3.4 last year, and ZiPS expects him to take another step forward this season projecting an fWAR of 4.5 this season. Expect him to battle with Aaron Sanchez this year to be regarded as the team's Ace.
Jaime Garcia - Monday's Probable Starter


The only new addition to the list, Jaime Garcia called St. Louis home for 8 years where he won the world series in 2011, until he fell victim to the trading carousel of the MLB. He was traded to the Atlanta Braves on December 1 of 2016, where he recorded a 4-7 record with the Braves before being traded to the Minnesota Twins on July 24 in 2017. Less than a week later, Garcia was traded to the New York Yankees. On February 15, 2018, Garcia signed a 1 year deal (with a team option for a 2nd) with the Toronto Blue Jays where he is hoping to again find his groove and play his way into a multi-year contract. He has a standard 4-pitch mix with no pitch extremely more or less dominant than the rest
In 2017, Garcia’s fastball had a value of 0.28. He threw a fastball 60.36% of the time in 2017, and considering it's above average results, is a good weapon for him. Garcia’s curveball took a statistical dive in 2017 as he had a career curveball 0.03, and in 2017 this value dropped to a dismal -1.87, putting it in the lowest tier of value for qualified starters. In 2017 he only threw a curveball 6.74% of the time, which means that the negative results didn't hurt him overly often. We shouldn’t expect to see Garcia throw a lot of curveballs this year unless he can get better results with it. Garcia’s slider value in 2017 was right on par with his career slider value at -0.79, so we may see some reduced usage, but this pitch does seem to be one of his weaker ones. Garcia also saw a small improvement in his change-up last year, bringing his value up to 0.24 compared with his career change-up value of 0.11. Perhaps Estrada and Garcia can work together to improve one another’s change-up as Estrada is considered a change-up specialist who had a terrible year last year.
Garcia put up an fWAR of 2.1 last season across his 3 teams. ZiPS projects him to put up an fWAR of 1.6 this season, which is perfectly acceptable for a 5th starter. If Garcia can get into a groove and continue to get good results on his fastball and change-up values, he will fit well into the Blue-Jays pitching rotation and he can be a valuable asset to the team for his pitching, leadership skills, and World Series experience. If not, it's a one-year deal that won't hurt in the long-run, which makes it a good signing considering where the Jays are at in this point of time.
Happy Opening Day everyone, we hope you'll follow along with QSAO as the season progresses for more Jays and MLB analysis. Catch the Blue Jays Opening game against the New York Yankees on March 29th at 3:37pm on Sportsnet Ontario.
Keep up to date with the Queen's Sports Analytics Organization. Like us on Facebook. Follow us on Twitter. For any questions or if you want to get in contact with us, email qsao@clubs.queensuca, or send us a message on Facebook.
Advanced Baseball Stats for Casual Baseball Fans /
We’ve all seen Moneyball. If you haven’t seen Moneyball, go see Moneyball, it’s on Netflix. The ‘Moneyball Revolution’ within baseball has shaken up the game, and changed the way that executives in baseball are looking at the game.
This will be an intro to some of the stats, metrics, and concepts that these executives are looking at. The goal here isn’t just to define what these things are, but rather to show how they can be used as tools of evaluation, to confirm the eye-test, or to just enhance the experience of the game. You might even end up sounding smart in front of your friends. When writing this article, I tried to include everything I wish I knew when first diving into the world of baseball analytics.
To avoid boring you with the history of how this Moneyball Revolution came to be, I’ll only drop one name that you should be familiar with - Bill James. Bill can be credited for being the pioneer of statistical analysis within baseball, as in the 1970s he was one of the first to publish this type of work that would be seen by a wide audience. Many people found his work fascinating, and attempted to replicate it, and - to make a long story short - after 30 years of this, the MLB finally took notice and the Moneyball Revolution began.
Concepts/Terms to Know:
The majority of these terms and concepts have been taken from Fangraphs, which is a site to find many advanced baseball stats and analysis. Links on where to find these concepts/stats will be provided.
Fielding Independent Pitching (FIP) - FIP is an adjusted Earned Run Average (ERA, or runs allowed by a pitcher excluding errors) metric that attempts to quantify what a pitcher’s value would be if they stripped out the defense component of the game. FIP assumes that all balls that are hit into play are given league average results on whether they fall for a hit or not. This way, a pitcher is not penalized for having a bad defense behind him, which certainly would affect their pitching results, and their ERA as a result. FIP is considered predictive as it has higher correlations across seasons than ERA, which makes sense considering it measures things that the pitcher can control and not things like defense which can fluctuate by game and by season. It is adjusted so that the league-average FIP is the same as the league-average ERA. This is done so that it can be easily compared to a player’s ERA to see if they are over/under-performing their FIP, and whether there may be any regression available for the player. There are cases of players who can consistently outperform their FIP numbers, such as Marco Estrada who in 2015-16 was elite at inducing weak contact (which can be considered a skill), so FIP assuming league-average results on balls-in-play would likely paint him as less effective than he actually is. On the other hand, his ERA did balloon to 4.98 in 2017 after significantly outperforming his FIP the previous two years, so the regression bug may have actually hit him as well.
FIP can be found on Fangraphs pitcher pages, such as Marco Estrada’s, next to ERA, where you will find his 2017 FIP to be 4.61.
Batting Average on Balls in Play (BABIP) - BABIP is a player’s batting average on only balls that were put into play, and the average is roughly .300 for both hitters and pitchers. The reason why this is a very important stat, is that it tends to stabilize after 800 balls in play. This means that if a player is having a stretch of months (or even a whole year) where they are achieving a much higher/lower BABIP than league average, and their career average, they are likely due for some regression as they have likely been getting lucky/unlucky on the results of the balls they have put into play. It’s worth noting that better hitters will likely have higher BABIPs, and vice-versa, and some players are able to sustain high BABIPs throughout their career without regression. The 2017 Toronto Blue Jays hitters ranked dead last in the entire MLB in BABIP in 2017, which can be seen as a source of optimism that they may achieve better results on their balls in play in 2018.
BABIP can be found on Fangraphs pitcher/batter pages, such as fringe prospect Dwight Smith Jr’s, who rode a .588 BABIP in 2017 to achieve his .370 batting average, which was less impressive and likely luck-driven given his ridiculous BABIP, and so he still earned a demotion and will likely not get an early look to crack the 2018 team.
Hit Probability - To temporarily stray from Fangraphs, Hit Probability is a metric that was introduced by Statcast at the beginning of the 2017 season to estimate the likelihood that a ball-in-play will be a hit, based on its launch angle and exit velocity compared to similarly hit balls in the past. Similarly to FIP, it attempts to negate the effects of defense and the ballpark on players who may have high percentage hits robbed by star outfielders making unlikely plays, or getting credit for many weak hits that likely would not be repeated. I did an analysis on how the 2017 Blue Jays were being affected by luck based on their hit probabilities, and throughout the season I saw players regress to what their averages were expected to be based on their Hit Probability numbers. The most extreme case was Devon Travis who had a cold start but still had high aggregated Hit Probability numbers but who, as the season progressed, positively regressed to the expected level. The quarter season report can be found here, and the mid-season report can be found here.
Hit Probability statistics can be found on Baseball-Savant here, where you can select any game and see the hit probabilities for all balls in play for that game.
Weighted Runs Created + (wRC+) - wRC+ is an attempt to quantify a player’s total offensive output into one total stat, based on the value of their contributions, after park adjustments. It uses the concept of Weighted On Base Average (wOBA) which simply gives the run value of each plate outcome. For example, it finds that triples contribute to runs roughly twice as often as a single, so a triple would be worth double the value of a single in this calculation. After doing this, you can find out the value of runs created by each player’s offensive outputs. wRC+ is a rate statistic, so it is very easy to be used even in smaller samples to see how a hitter has been performing. It is one of the best tools to use when evaluating a hitter’s offensive abilities. The league average wRC+ is 100, and each point above 100 is indicative of one percentage above league-average.
It can be found on the batter pages on Fangraphs, such as Mike Trout’s, who was the 2017 leader at 181 wRC+, beating Aaron Judge by 8 points even with 19 less home runs.
Park Adjustments - No Two Parks are The Same:
To state the obvious, no two MLB ballparks are the same. The most noticeable difference is obviously the different dimensions, but additionally there are many other factors at play such as weather and other environmental factors. As a result, there tend to be plenty of differences in player performance at different parks, and adjustments are calculated to reduce the effects of these parks as best as possible. They typically are separated for left and right-handed batters, since parks are not always symmetrical, they may favour one-sided batters over another.
Colorado’s Coors Field is regarded as the extreme case of a ‘Hitter’s Ballpark’ - hitters tend to generally perform well there due to the high altitude and large outfield so batters can expect more balls in the outfield to fall for hits. Conversely, AT&T Park in San Francisco is regarded as the largest case of a ‘Pitcher’s Ballpark’ due to its high walls and damp air. Rogers Center in Toronto is ranked as the 8th best ballpark for hitters. Four out of five ballparks in the AL East are considered to favour the hitter over the pitcher, so that could be one of the reasons why a team based in Toronto fails to attract premium free agent pitchers.
The War on WAR:
If you only have time to learn about one advanced stat in baseball, Wins Above Replacement (WAR) is the one to go with. WAR is an attempt to quantify the overall value of a player’s contributions into one easy number. It simply could be put as: The number of wins that you can expect your team to add while employing the player, compared to a different player that would be easily acquired from the minor-leagues or a team’s bench.
WAR is a counting stat and is based on what happened, rather than what will happen in the future. If an MVP-calibre player only played 20 games, they may have a lower WAR than many inferior players, due simply to the fact that they didn’t play enough games to accumulate a high WAR total.
Fangraphs goes into more details of what exactly goes into the WAR stat for hitters, but essentially it is the total value of runs that a batter contributes to the team in the areas of: hitting, baserunning, fielding, divided by how many wins a team can be expected to win with those runs added (Runs/Win generally fluctuates by year but is ~10). It is then adjusted by position (For example: CF is much harder to play than 1B, so they are credited accordingly - more here), adjusted by ballpark, and adjusted to consider the ‘Replacement Level’ player and how much more/less valuable that player is to this imaginary player.
For Pitchers, it is much more complicated, so it’s best to outline the two different WAR stats that are most commonly referenced. First, there’s Fangraphs WAR, commonly referred to as fWAR. fWAR uses Fielding Independent Pitching (FIP) during their calculations, instead of ERA. Recall that FIP is generally regarded as a more predictive stat than ERA, so fWAR could be better used as a tool to project future pitching performance. Conversely, Baseball Reference uses ERA when calculating their bWAR stat. ERA is based on what has actually happened, and could be influenced by team defense among other external effects. These effects are variable by game and are out of the pitcher's control, so this should be seen as more of a ‘what happened in the past?’ stat, rather than a ‘what should I expect in the future?’ stat.
Conclusion
I hope that this article has given you an introduction to some tools to enhance your viewership of baseball. These tools were selected as stats that may challenge how the game is traditionally viewed. Player’s are often over/undervalued by fans since traditional metrics such as batting average will never paint the full picture of their contributions. Hopefully the concepts learned today will allow you to form more complete opinions on player’s teams while enjoying the games.
Keep up to date with the Queen's Sports Analytics Organization. Like us on Facebook. Follow us on Twitter. For any questions or if you want to get in contact with us, email qsao@clubs.queensuca, or send us a message on Facebook.