
A look at each of the three playoff-bound Canadian NHL teams’ performances this season, and what their chances are heading into the 2019 NHL Playoffs.
Read MoreWinnipeg Jets
Analysis: How five elite scorers get their goals /

There’s something beautiful about scoring a goal.
Goals are the building blocks that make up hockey success, both on the individual and team level. They are a single moment in time, a culmination of a series of plays that ends with one team’s attack successfully defeating the other’s defense.
Teams are forever searching to add goals to their lineup, and for good reason. Goals win games, playoff series and, eventually, championships.
Goal-scoring is a repeatable talent, and while certain NHLers are far better at it than others, each player does it their own way. Each scorer exhibits unique tendencies of shot type selection and shot location.
Alex Ovechkin, Evgeni Malkin, Connor McDavid, Nikita Kucherov, and Patrik Laine are five of the best scorers in the game. Of the 10 goal leaders for the 2017-18 season, these five players possess the highest career goals per game rates. They are the elite of the elite when it comes to putting the puck into NHL nets.
I wanted to explore how they each do it differently.

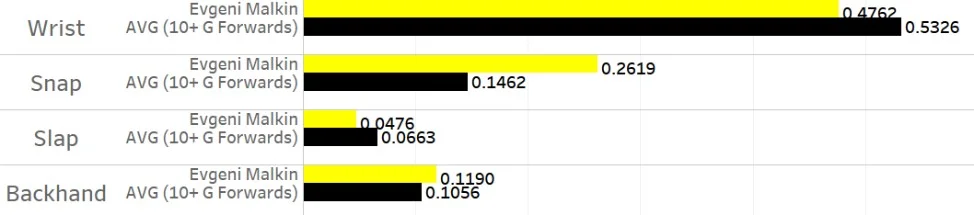
The above visualization separates by shot type to show how each player scored their goals in the 2017-18 season. Overall, the most popular shot type was wrist shot, followed by snap shot, slap shot, and finally backhand.
It should be noted that the ‘AVG (10+ G Forwards)’ represents a weighted average of the relevant shot rate among all forwards who scored 10 or more goals, weighted by the number of goals that they scored. It’s a way to quantify ‘normal’ rates for the league’s goal scoring forwards.
Let’s take a more detailed look at each of these five players.
Alex Ovechkin


It’s no secret that Alex Ovechkin is really good at scoring goals. Since breaking into the league, he’s won the scoring title 7 times and no one else has won it more than twice. Sitting at 607 career goals, Ovi continues to propel himself further up the list of all-time greats. His 0.605 goals per game ranks first league-wide, beating out all other forwards by at least 0.08 G/GP.
Ovechkin loves slap shots, which should come as no surprise to anyone who’s watched Washington’s power play operate. His 17 slap shot goals were an uncontested 1st league-wide, with Steven Stamkos being the only other forward to score more than 7. Ovechkin’s slap shot is so powerful that it beats goalies clean even whey they know it’s coming, meaning that it can be unleashed without needing to be disguised.
Equally noteworthy, Ovechkin scored just 31% of his goals by wrist shot, which represents the lowest rate among all 32 players who scored 30+ goals.

Heat Map courtesy of Micah Blake McCurdy's website HockeyViz (https://hockeyviz.com)
The red areas in the above heat map show where Ovechkin shoots more frequently than the rest of the league. Ovechkin makes an absolute killing at the top of the left faceoff circle, often referred to as the ‘Ovi Spot’. This area lines up with Ovechkin’s average shot distance of 32.3 feet, which ranked in the 80th percentile among the league’s forwards.
Although it’s not reflected in the heat map, much of Ovechkin’s damage is done with the man advantage playing the left point. Of his 49 goals, 17 were scored on the power play, which ranked 2nd only behind a player further down this list. His remaining 32 were scored at even-strength, which again ranked 2nd in the league. Elite scoring across both special teams and even-strength situations throughout his career has propelled Ovechkin to the status of the league’s premier goal scorer.
Evgeni Malkin

Despite being the second-best player on his team, Malkin has put together the resume of an elite goal scorer. He’s scored 75 goals in 140 games over the past two seasons, which converts to 44 goals over an 82-game season. His career goals per game of 0.472 ranks 6th among active forwards, placing him in elite company.
What makes Malkin dangerous is his offensive versatility; he can score from anywhere on the ice. Equal parts power and precision, Malkin possesses a variety of weapons. His snap shot goal rate clocks in at roughly double the league average (his 11 snap shot goals ranked 4th), but his middle-of-the-pack rates for wrist shots, slap shots and backhands speak to his balanced toolkit. Malkin does not rely on a single shot type to score goals, meaning that defenders must respect all shot types that Malkin credibly threatens.

Heat Map courtesy of Micah Blake McCurdy's website HockeyViz (https://hockeyviz.com)
Did I mention that Malkin can score from anywhere? The sea of red is the beauty of Evgeni Malkin. He’s one of the most complete offensive players in the league. In addition to his heavy shot, his slick puck-handling ability and power forward frame allow him to generate shots and scoring chances at elite rates in the low slot area. His shot distance ranked just inside the upper third league-wide, influenced both by his crease-area chances and his shot activity in the high slot.
Malkin joins Ovechkin as the only two players in the league to finish top-10 in both even-strength goals and power play goals. He scored 28 times at evens, ranking 7th, and 14 times with the man advantage, ranking 6th. Malkin is one of the game’s most dangerous players in the offensive zone, and his goal scoring abilities rank among the NHL’s elite.
Connor McDavid


At this point, not much more needs to be said about Connor McDavid’s offensive game. His 108 points were enough for a second consecutive Art Ross (but not Hart) Trophy. He’s the been the league’s best forward for the last two years, and he’s only 21 years old.
But is he a goal scorer? While it’s true that McDavid has been viewed more as a set-up man than a finisher thus far in his young career, in 2017-18 we saw a transformation in McDavid’s offensive role. Compared to the year prior, McDavid scored 11 more goals and took 23 more shots. He became more of a trigger man, electing to attempt shots more often instead of looking to pass. This development calls to mind a young Sidney Crosby, who recorded seasons of 70 and 84 assists before breaking out for 51 goals in 2009-10.
McDavid prefers to score goals with his wrist shot. His 25 wrist shot goals ranked 3rd league-wide behind only Nathan MacKinnon and Eric Staal, while his rate of 61% ranked 9th among the 32 players who scored 30+ goals. He hardly ever takes slap shots, registering just 7 of these shots during the entire season, of which just 1 beat the goalie. Rather than rely on strength to generate power, McDavid creates offense thanks to generational skating and elite-level hands. He’s able to create and navigate space better than anyone else on the planet and puts himself into positions where a quick and accurate wrist shot is more than enough to beat the goalie.

Heat Map courtesy of Micah Blake McCurdy's website HockeyViz (https://hockeyviz.com)
McDavid has figured out hockey’s (not-so) secret formula: if you get close to the net, you’re more likely to score. He's extremely effective at using his speed, hands, and vision to attack the most dangerous area of the ice. McDavid’s sub-20’ average shot distance is a testament to his elite ability to generate scoring chances from the crease and low slot area.
McDavid’s special teams split is intriguing. His 35 even-strength goals ranked first in the entire NHL, but his 5 power play goals tied him for 96th among forwards. This latter can be explained both by Edmonton’s league-worst power play and also McDavid’s primary role as a puck distributor on the top unit. If Edmonton’s power play improves, which is likely given regression to the mean, McDavid’s special teams goal-scoring could very well take a step forward and supplement his elite even-strength scoring totals. He is already the game’s best forward and he poses a legitimate threat to become the game’s best scorer sooner rather than later.
Nikita Kucherov


A late 2nd round pick, Nikita Kucherov has emerged from relative anonymity to become one of the league’s most dangerous forwards. His 79 goals over the past two seasons place 3rd league-wide, and he was one of just three players to break 100 points in 2017-18.
While Kucherov’s absurdly accurate wrist shot remains his primary weapon (4th in wrist shot goals with 24), he is equally dangerous on the backhand. He scored 8 times (21% of all goals) on his backhand, ranking 2nd among 30+ goal scorers to Brad Marchand in both raw total and rate. Kucherov’s ability to score using wrist shots and backhands is all the more impressive considering that he shoots from further away than 93% of other forwards. He can be successful from this range without relying on the power of slap and snap shots due to his innate ability to find and exploit tiny gaps that goaltenders leave open. His shots are precise and accurate, and he excels at finding any available daylight.

Heat Map courtesy of Micah Blake McCurdy's website HockeyViz (https://hockeyviz.com)
An incredibly versatile player, Nikita Kucherov generates shots at elite rates all over the mid and high-slot. Rather than favour a specific shooting location, he elects to test the goalie from all areas of the offensive zone. This makes Kucherov unpredictable, which helps explain why his quick-release wrist shot and backhand are so devastating. He doesn’t shoot much from the crease area, but driving the net really isn’t part of how he creates offense.
Kucherov was more of a goal-scorer at even-strength than on the power play in 2017-18. He recorded 31 ES goals, one of just four players to crack 30, compared with 8 on the man advantage. He played more of a set-up role on Tampa Bay’s 3rd-ranked power play, registering 28 assists as he regularly sent cross-ice passes to Steven Stamkos (15 PP goals). Kucherov’s outstanding season cemented his status as one of the most dangerous goal scorers in the NHL, and at the prime age of 25 he’s as good a bet as any to repeat his offensive dominance next season.
Patrik Laine


At just 20 years old, Patrik Laine is already among the game’s premier snipers. His 44 goals ranked 2nd league-wide in 2017-18, fueling the Jets to their franchise-best season. Laine’s biggest asset is his shot, which may very well be the best in the league. Among current NHLers with 50+ career goals, Patrik Laine’s career shooting percentage of 18.0% ranks 2nd behind only Paul Byron. Byron, meanwhile, had an average shot distance of 19.3 feet in 2017-18, least of all eligible forwards, while Laine’s average shot came from 36.1 feet, ranking in the 97th percentile. The kid can shoot the puck.
Laine’s weapon of choice is his snap shot, which he routinely uses to one-time pucks into the back of the net. His quick release and accurate shot placement resulted in 14 snap shot goals in 2017-18, which tied for the league lead with Phil Kessel. He also is a fan of the slap shot, with his 6 slap shot goals placing him in a tie for 4th among all forwards.

Heat Map courtesy of Micah Blake McCurdy's website HockeyViz (https://hockeyviz.com)
Here we see Laine’s favourite shooting locations. A right-handed shot, Laine loves to one-time pucks from the high slot. The fact that he’s able to beat the goalie so consistently from so far away speaks to his talent as a shooter. Like Ovechkin, Laine’s shooting locations lack variety, but he’s so good from his spots that goalies have difficulty stopping the shot even if they can anticipate that it’s coming.
The triggerman for the Jets’ 5th-ranked power play, Laine lead all NHLers with 20 power play goals in 2017-18. He would routinely patrol the space between the left half-wall and left point, making himself open to cross-seam passes and one-timing his quick snapshot on net. His 24 even-strength goals tied for 20th in the league, so he’s no slouch at 5-on-5 scoring either.
Since breaking into the league, Laine has used his generational shot to pick apart opposing goalies. The odds-on favourite to inherit Ovechkin’s throne as best goal-scorer is the league, the sky’s the limit for a kid who potted 44 goals in just his second season in the league.
Conclusion
So there we have it; the modus operandi of five of the game’s elite. While Ovechkin, Malkin, McDavid, Kucherov, and Laine possess a shared gift for putting the puck in the net, they achieve it with vastly different sets of techniques, skills, and strategies. There is no uniform way to score a goal across the league, but all that matters is that it goes in.
With goals representing the currency of the NHL, goal-scorers are among the most valuable assets out there. Scoring goals wins you games, playoff series, and, as 32-year old Alex Ovechkin and 31-year-old Evgeni Malkin know, Stanley Cup championships. Kucherov (25), McDavid (21), and Laine (20) have not yet won hockey’s ultimate prize but given their relative youth and their otherworldly ability to put the puck in the net, they might not be far away.
Data courtesy of Hockey Abstract (http://hockeyabstract.com/testimonials), Natural Stat Trick (https://naturalstattrick.com), and NHL.com (https://nhl.com)
Shot heat maps courtesy of Micah Blake McCurdy’s wonderful visualization website HockeyViz (https://hockeyviz.com)
Cover photo credited to NHL.com
Playoff Preview: Winnipeg Jets vs. Minnesota Wild /
By Owen Kewell and Scott Schiffner
The calm before the storm.
The brackets have been setup, the matchup strategies developed, and the razors hidden away. For the first time since June, playoff hockey is here. We are mere hours from the puck drop that’ll kick off the 2017-18 Stanley Cup Playoffs, the starting pistol for a two-month long marathon where only one team can cross the finish line. In anticipation of this, we at the Queen’s Sports Analytics Organization decided to tee up the matchups featuring Canadian teams. We start with the Winnipeg Jets, who will play host to the Minnesota Wild on Wednesday night. The first round playoff series between the Central division rival Winnipeg Jets (2nd, 52-20-10) and the Minnesota Wild (3rd, 45-26-11) is an exciting matchup that is sure to feature a high level of speed, talent, and physicality from both sides. Both squads have enjoyed productive seasons, with the Jets posting the best record of any Canadian team, finishing with 114 points.
Offensive Matchup
Winnipeg enters the series with the reputation of having one of the most lethal forward groups in the league. Lead by a rejuvenated Blake Wheeler (91 points) and 44 goals from sophomore winger Patrik Laine, the Jets possess high-end offensive firepower that has torched the league for the better part of the season. Minnesota, meanwhile, enjoyed strong seasons from Eric Staal (76 points), Mikael Granlund (67 points) and Jason Zucker (64 points). Let’s take a quick look at some summary statistics from the regular season.

Stats from Corsica.hockey
The Jets scored 23 more goals than the Wild over the season, though much of this can be explained by their superior power play. Jets skaters had a higher shooting percentage, though the difference is too small to reasonably infer superior shooting ability. The Jets outperformed the Wild at generating shot attempts and scoring chances, though the Wild were able to create more high-danger scoring chances. While individual point totals suggest Winnipeg has more high-end forwards, we can examine depth charts to clarify the picture.

The graphic above shows the current depth charts (courtesy of Daily Faceoff) and each player’s rank among NHL forwards in even-strength primary points per 60 minutes. Here we confirm our belief that Winnipeg’s forward group is much deeper than Minnesota’s, as we can see that six Jets produced at a top-line rate compared to just three Wild players. To understand how the above results were achieved, we turn to heat maps.

Heat maps created and available on HockeyViz.com
The red areas indicate locations where a team shoots more frequently than league average, while blue is the inverse. In these maps we can see two teams who have a very different approach to generating offence. The Jets set up a triangle of attack, which results in a high volume of shots coming from the points and the mid-high slot. Being able to attack the slot with such regularity doubtlessly contributed to the success that the Jets experienced this season. The Wild, meanwhile, seem to play more on the perimeter with the goal of funneling pucks towards the crease. This explains why Minnesota produced more high-danger chances than the Jets despite generating less total scoring chances.
The offence matchup clearly favours Winnipeg. The Jets have the top-end firepower and the depth to roll scoring threats on every line. Throw in a dangerous power play, and the Jets are dangerous enough to make life miserable for anyone attempting to contain them.
Defensive Matchup
Winnipeg Jets:
Josh Morrissey – Jacob Trouba
Joe Morrow – Dustin Byfuglien
Ben Chiarot – Tyler Myers
Minnesota Wild:
Jonas Brodin – Matthew Dumba
Carson Soucy – Jared Spurgeon
Nick Seeler – Nate Prosser
The Winnipeg Jets allowed 216 goals in 2017/18, with 144 coming at even strength, while Minnesota allowed 229 goals (144 at 5v5). Winnipeg gave up an average of 31.9 shots per game, while Minnesota surrendered 31.3 on average. In terms of possession metrics, Winnipeg controlled 51.42% of shot attempts over the course of the 2017/18 season, good for 10th in the league, while Minnesota sits 29th with only 47.17% of shot attempts.
Comparing the top pairing defencemen for both teams using HERO charts:

http://ownthepuck.blogspot.ca/2017/05/hero-charts-player-evaluation-tool.html
The Minnesota Wild’s defence corps has taken a significant blow going into the postseason with the loss of number 1 defenseman Ryan Suter, who logged an average of 26:46 minutes of ice time per game before suffering a season-ending ankle injury on March 31. Veteran defender Jared Spurgeon remains a game-time decision due to an injured hamstring. The burden to cover these minutes will fall squarely on the shoulders of young defensemen Jonas Brodin and Matt Dumba, who will be counted on in key defensive situations. The Winnipeg Jets boast a tough lineup of physical defencemen, including Dustin Byfuglien and Tyler Myers, who will look to shut down the Wild’s top offensive lines. The Winnipeg Jets have the edge when it comes to top-tier defencemen, as well as much stronger depth on the blueline overall.
Finally, let’s compare the heat maps for both Winnipeg and Minnesota in their own defensive zones.

Heat maps created and available on HockeyViz.com
Taking a look at these maps, both teams are effectively limiting the number of scoring chances from high-danger scoring areas around the net (<25 feet) and in the slot. Minnesota’s heat map clearly indicates that the majority of chances are coming from the point (>40 feet out from the net) and down the right side, a potential weakness that Winnipeg’s quick wingers will look to exploit. Winnipeg’s defence is managing to limit almost all chances from high-scoring areas directly in front of their net, keeping the majority of shot attempts to the outside perimeter of the rink.
Goaltending Matchup:
We close our positional matchups by considering goaltending. Winnipeg will rely on Connor Hellebuyck, who broke out this year to post the winningest season ever by an American goalie. The young upstart will go toe to toe with Devan Dubnyk, the waiver-wire reclamation project that Minnesota has turned into a competent starter. Dubnyk has the qualitative advantage of playoff experience, but let’s see how the numbers stack up.

Unless otherwise specified, the above percentages reflect even-strength play. We see that Hellebuyck and Dubnyk performed similarly at even strength, as their save percentages for low, medium and high danger shots are all within a single percentage point. Where we see a difference, however, is on the special teams. While these stats are influenced by the quality of special team units, we see that Hellebuyck has significantly outperformed Dubnyk on both power plays and penalty kills. We also see that Hellebuyck saved about 2 goals more than expected given the quality of the shots being faced, whereas Dubnyk was over 7 goals in the hole on this metric.
If there had to be a choice between the two to start a Game 7, Connor Hellebuyck would be a safe choice. Despite his inexperience, his exceptional season played a huge role in Winnipeg’s ascension to 2nd place in the NHL’s overall standings. He’s shown to be better than Dubnyk at stopping the puck, and for that reason, he gives his team a better chance to win.
In summary, the numbers indicate that Winnipeg has the advantage in terms of offense, defense, and goaltending. The Jets enter the playoffs on an absolute tear, having won 11 of their last 12 games. They are 3-1-0 vs. the Wild in their season series. We are predicting that the Winnipeg Jets will be victorious in their first-round series against the Minnesota Wild, likely in 5 or 6 games.